III – The Carbon Market (part 1)
1 Sources of Anthropogenic GHG emissions
Carbon emissions are not just CO2 emissions; the Kyoto Protocol includes 6 greenhouse gases and its respective Global Warming Potential (GWP). Different greenhouse gases have a different impact on the atmosphere; GWP is the estimated measure of how much a given mass of greenhouse gas will contribute to global warming. The GWP used by the IPCC R4 is calculated over a period of 100 years and uses 1 tonne of CO2 as the baseline (GWP of 1).
The greenhouse gases included are:
– Carbon Dioxide (CO2) = GWP of 1
– Methane (CH4) = GWP of 25
– Nitrous Oxide (N2O) = GWP of 298
– Hydrofluorocarbons (HFC)= GWP of 1,430 to 14,800
– Perfluorocarbons (PFC) = GWP of 7,500
– Sulphur Hexafluoride (SF6) = GWP of 22,300
The anthropogenic GHG emissions come from human activities. GHG are produced in large quantities, particularly through the burning of fossil fuels and deforestation. Figure 1 – Source of GHG emissions, source (IPCC AR4, 2007) shows that most emissions come from energy supply, industry and forestry followed by transport and agriculture.
")
Figure 1 – Source of GHG emissions, source (IPCC AR4, 2007)
2 The Targets
Under the Kyoto Protocol, 38 industrialized countries have signed a binding agreement to limit or reduce their emissions to an average of 5% against 1990 levels over the period 2008-2012. Most notably, the US did not ratify the Protocol; Australia only ratified it in 2007 and Canada, a country that previously ratified the Kyoto Protocol is no longer working towards meeting the target (UNFCCC, 2006).
The situation is now changing, during the G8 meeting at L’Aquila, Italy in July 2009, Canada, France, Italy, Germany, Japan, Russia, the United Kingdom and the United States, have agreed to limit global average temperature rise to 2C above pre-industrial levels to avoid the worst impacts of climate change. A full range of policy tools have to be used to reach that goal and employ immediate and substantial reductions in GHG emissions.
Figure 2 – Global emissions target, source (DECC 2009) illustrates the targets of global emissions needed against “business as usual” emissions between 1990 and 2050. In 2000, global emissions were 45 GtCO2e and 49 GtCO2e in 2004. The goal is to reach 44 GtCO2e by 2020 and 20 GtCO2e by 2050; a target of 50%.
")
| Figure 2 – Global emissions target, source (DECC 2009) |
“The costs of not acting to tackle climate change are far greater than the costs of action. (…) As well as acting urgently, the international community will need to ensure that emissions reductions are effective, economically efficient and equitable” (Stern, 2006). The amount of finance needed for adaptation, mitigation, forestry and technology will reach an estimated $100bn a year by 2020 (Lazarowicz, 2009). The private sector is expected to bring the largest financial contribution through the carbon market and both developed and developing countries’ public finance will provide the rest of the share.
One of the policies in operation to help the private sector to reach that target is known as Cap and Trade.
3 Cap and Trade
Cap and trade is one of many tools used to reduce emissions. This tool sets a binding cap at national and emitter level with financial implications applicable to companies that fail to meet their targets. Emission reductions make economic sense, in its simplicity: carbon markets trade the reduction of carbon emissions into the atmosphere.
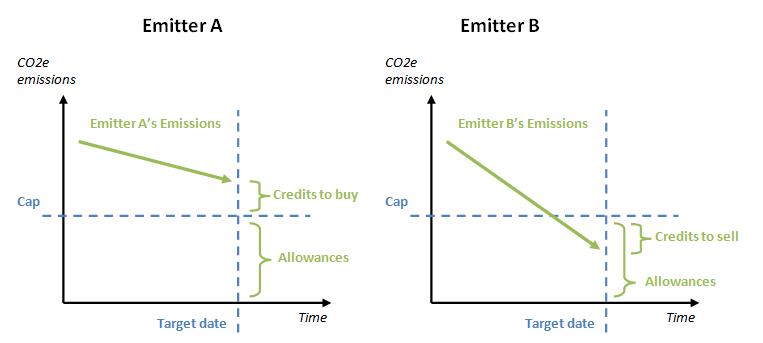
Allowances are provided to emitters either through purchase or allocation in order to achieve reductions. These reductions are traded in the market as carbon credits whereby one carbon credit is equal to one tonne of CO2e. “Figure 3 – Trade in the carbon market, source demonstrates how the carbon market operates. Emitter A has reduced its emissions but the reduction is not enough to meet the target, therefore Emitter A will have to buy carbon credits to offset the remaining emissions. Emitter B has reduced its emissions far more than its target and therefore Emitter B can sell the credits to Emitter A. The overall target is reached and a reduction occurred as it does not matter from which location the emissions originated as all are added in the atmosphere. Supply and demand will set the price for carbon credits; the greater the demand for carbon credits, the higher the price will be and more money shall be transferred to companies that have reduced their emissions to below the cap. Governments can also lower the cap through reducing supply. This will increase demand and eventually increase the price of the carbon credits (Yamin, 2005).
 illustration (The Author, 2009)")
| Figure 3 – Trade in the carbon market, source adapted from the text (Yamin, 2005) illustration (The Author, 2009) |
A company will follow the price of the carbon to define its carbon strategy. A company that is able to reduce its emissions to a cost lower than buying the carbon credits will do so. An equilibrium point will be reached where it may become cheaper for the company to buy carbon credits rather than reduce their own emissions. This means that another company has managed to reduce the emissions at a lower cost and produce carbon credits. The market has managed to reduce emissions at the lowest cost possible.
There are available mechanisms that bring more flexibility to trade the carbon credits; in addition the mechanisms are an incentive to help developing countries to grow sustainably. These mechanisms are included in the Kyoto Protocol.

Leave a comment